⚠ Notice: educational and study content. It does not constitute financial advice or trading signals. Trading Forex and gold involves a high risk of losing your capital.
Odino Project · Study path
Study path
Nine levels in progressive order to study the method applied to gold (XAUUSD): from market basics
and risk management to the complete method, with a diary and after-the-fact review.
Each level sets out objectives, an introductory explanation, a demo account exercise and common mistakes.
The levels should be tackled in order: each one builds on the previous ones. For now each level offers an
introductory outline; the full content is in preparation.
XAUUSD is the price of gold expressed in US dollars. For each period, the candlestick chart summarises the opening price, the closing price, the high and the low; the timeframe is the duration of each candle (for example M5 = 5 minutes, H1 = 1 hour, H4 = 4 hours). This study path uses the convention 1 pip = $0.10 of price movement; some brokers define the gold pip differently, so it is worth checking the symbol specifications. The spread is the difference between the buying and selling price and it varies during the day. Session times (Asia, London, New York) are always given in UTC.
Learning objectives
Read a candle: open, close, high and low.
Tell the timeframes apart (M5, M15, H1, H4) and know when to use them.
Measure a distance in pips with the convention 1 pip = $0.10 and understand the spread.
State market sessions in UTC and use a demo account.
Demo account exercise
Open a demo account and find the spot gold symbol. On an H1 chart, note the open, close, high and low of five consecutive candles and calculate the distance in pips between the high and the low. Observe the spread at three different times of day and note it down with the time in UTC.
Common mistakes
Confusing the gold futures price with the spot price.
Noting local times without stating the time zone.
Ignoring the spread when measuring distances.
2
Level 2
Risk management
Full content in preparation
Before studying entries you need to know how much you are willing to lose on a single trade. The stop loss marks the point at which the initial idea is considered wrong. Position size is derived from the accepted risk and the stop distance: for the same risk, a wider stop requires a smaller position. The risk/reward ratio compares the potential loss with the potential gain. No method guarantees profits and losing streaks are normal.
Learning objectives
Define the risk per trade as a share of capital.
Calculate position size from the risk and the stop loss distance.
Calculate the risk/reward ratio.
Accept losses as part of the process: no method guarantees profits.
Demo account exercise
On a demo account, with hypothetical capital, calculate the position size for three different stop distances while keeping the same percentage risk. Check your calculations against the symbol specifications at your broker (value per lot, minimum lot and lot step).
Common mistakes
Moving the stop loss to avoid closing at a loss.
Increasing position size after a loss to make it back.
Not knowing the value of one pip per lot on your own account.
3
Level 3
Market structure
Full content in preparation
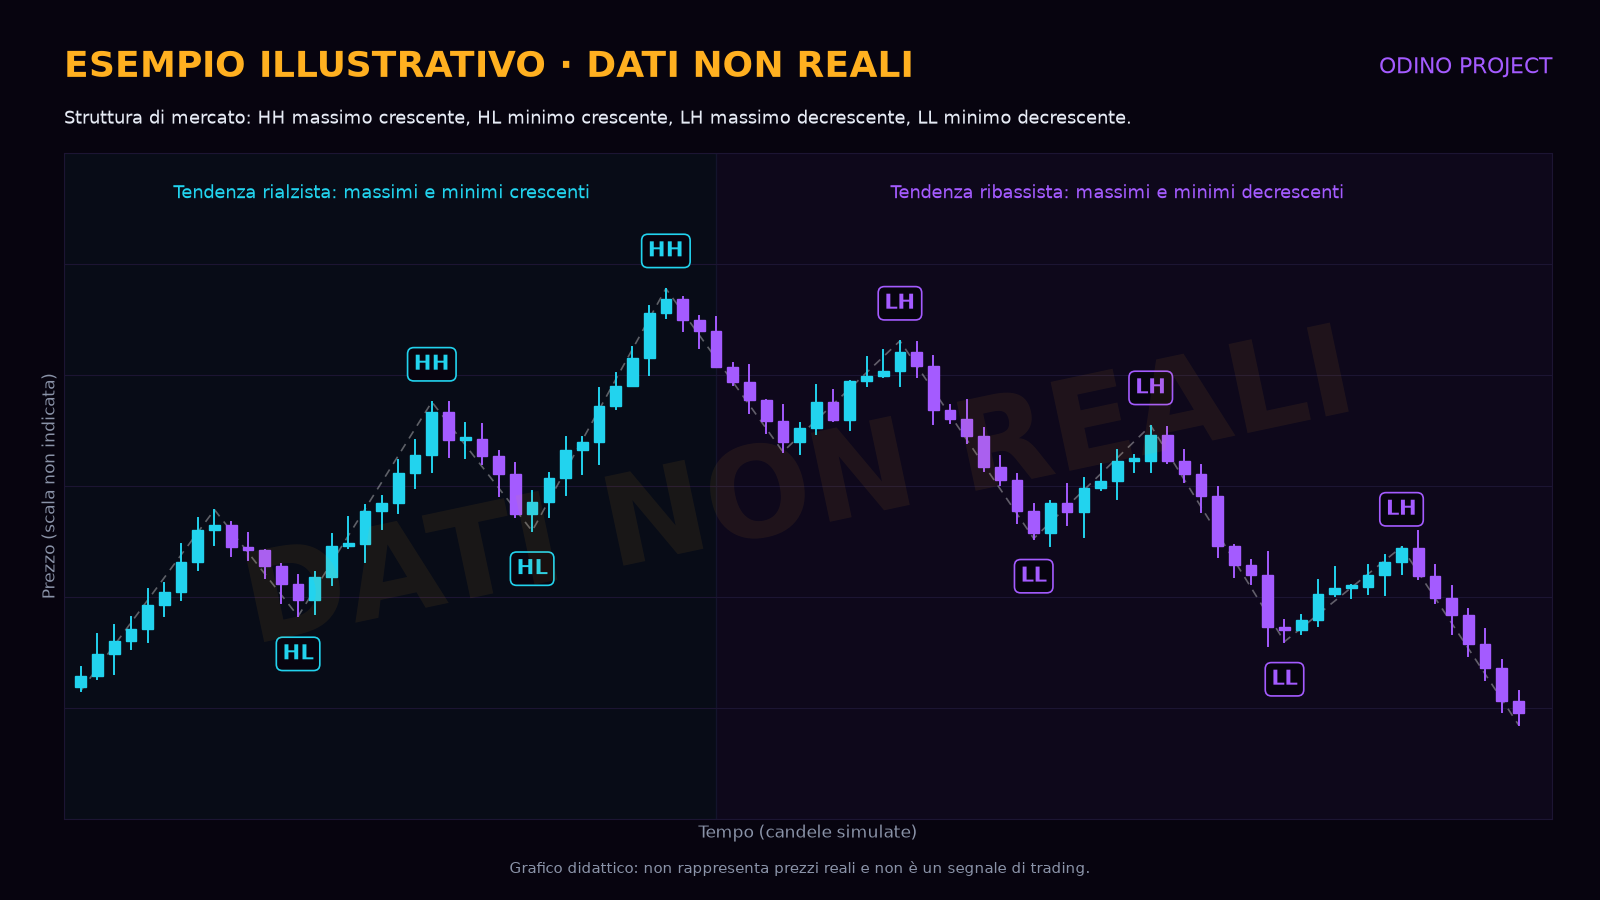
A swing is a turning point in price: a high with lower candles on either side, or a low with higher candles on either side. A sequence of higher highs (HH) and higher lows (HL) describes an uptrend; lower highs (LH) and lower lows (LL) describe a downtrend. When highs and lows stay within a band, the market is ranging.
Illustrative example · non-real data. Optional chart with simulated data, created for educational purposes.
It does not represent real prices and is not a signal.
Learning objectives
Identify swings: significant highs and lows.
Label the HH, HL, LH, LL sequence.
Distinguish an uptrend, a downtrend and a range.
Recognise when the sequence breaks down.
Demo account exercise
On an H1 chart, mark the last 8-10 swings and label them HH, HL, LH or LL. Decide whether the market is trending or ranging, then repeat the exercise on H4 and compare the two readings.
Common mistakes
Marking every small fluctuation as a swing.
Switching timeframe halfway through the analysis.
Seeing a trend where there is a range.
Retracements after a break of structure
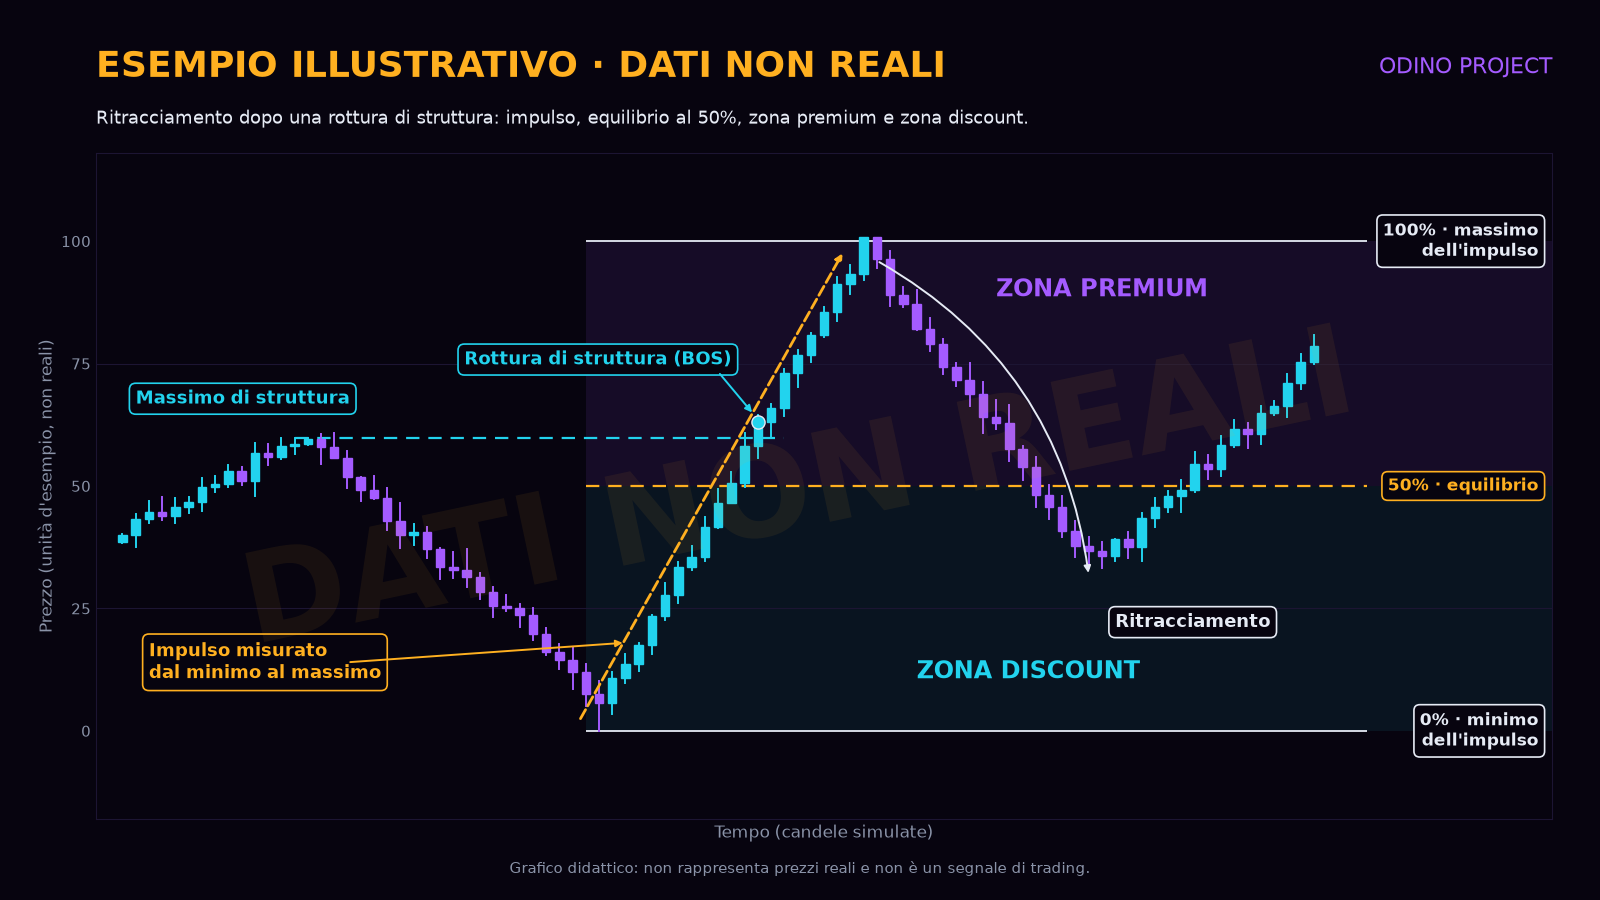
After a break of structure, price rarely continues in a straight line: it often pulls back over part of the move it has just made before resuming or changing direction. This pullback is called a retracement.
To describe it, first measure the impulse, i.e. the leg that broke the structure: in a bullish break it runs from the low where the move started to the high reached after the break; in a bearish break, conversely, from the high to the low. The midpoint of the impulse is the equilibrium (50%). The upper half, above 50%, is the premium zone: prices that are high relative to the impulse. The lower half, below 50%, is the discount zone: prices that are low relative to the impulse.
We study where price retraces relative to these zones because it lets us describe the depth of a retracement in a consistent way that can be compared from one case to the next: after a bullish break, a retracement that stops in the premium zone is shallow, while one that reaches the discount zone is deeper. By recording cases in the diary you can check over time, on historical data, how price behaved in each situation, without taking the outcome for granted.
Illustrative example · non-real data. Chart with simulated data, created for educational purposes; the values on the price axis are example units.
It does not represent real prices and is not a signal.
Key concepts
Retracement: price moving back over part of the impulse.
Impulse: the leg that broke the structure, measured from low to high (or from high to low).
Equilibrium at 50%; premium zone above, discount zone below.
Where the retracement sits is something to observe, not a prediction.
Demo account exercise
On historical H1 or H4 charts in a demo account, find ten breaks of structure. For each one, mark the impulse from the low to the high of the leg that broke the structure (from the high to the low if the break is bearish), draw the 50% level and shade the premium and discount zones. Then scroll the chart forward and note how far the retracement went, in which zone price reacted and what happened next, with the date and time in UTC.
Common mistakes
Choosing the wrong impulse: starting from a low or ending at a high that does not belong to the leg that broke the structure.
Measuring the impulse on a different timeframe from the one on which the break was identified.
Treating a move into the premium or discount zone as an automatic signal: the zone tells you where price is, not what it will do.
4
Level 4
Key levels and multi-timeframe analysis
Full content in preparation
Support and resistance are zones where price has reacted several times in the past. Multi-timeframe analysis works top-down: on H4 you define the prevailing direction and the main zones, on H1 you refine the structure, and on M15 you observe how price approaches the zones. The M5 timeframe is used only in the entry phase (Level 6).
Learning objectives
Draw support and resistance as zones, not as single lines.
Follow the top-down order: H4, H1, M15.
Check that the timeframes are consistent with each other.
Recognise when the timeframes are in conflict.
Demo account exercise
Mark two or three main zones on H4. Move to H1 and then to M15 without deleting the previous zones, and note where the timeframes agree and where they conflict.
Common mistakes
Drawing so many levels that the chart becomes unreadable.
Starting from the lowest timeframe.
Treating a level as an exact price rather than a zone.
5
Level 5
Breaks of structure
Full content in preparation
A BOS is a break in the direction of the current trend, for example a new high above the previous one in an uptrend. A CHoCH is the first break against the sequence, for example a close below the last higher low in an uptrend, and it indicates a possible change in the market's character. A false breakout occurs when price moves beyond a level but quickly comes back inside it.
Learning objectives
Distinguish a BOS (break of structure) from a CHoCH (change of character).
Decide in advance what counts as a break: a candle close or just a wick.
Recognise false breakouts.
Read every break in the context of the higher timeframe.
Demo account exercise
On historical H1 or M15 data, find five BOS and three CHoCH. For each one, note whether the break happened with a close or only with a wick, and what happened in the following candles.
Common mistakes
Treating every wick beyond a level as a CHoCH.
Ignoring the trend on the higher timeframe.
Changing the definition of a break from one case to the next.
6
Level 6
Price action and entry
Full content in preparation
Once the context (structure and zones) has been defined, price action helps you understand whether price is reacting in a zone. Confirmation candles show a shift in pressure between buyers and sellers. Timing is studied on the M5 timeframe, observing the price reaction without anticipating it.
Learning objectives
Recognise confirmation candles, such as a long-wick rejection or an engulfing candle.
Link the confirmation to a zone defined beforehand, not the other way round.
Study entry timing on M5.
Write down the conditions before looking at the outcome.
Demo account exercise
On historical data in a demo account, choose some zones already marked in the previous levels, switch to M5 and note which confirmation candles appear and what happens next. Write down the conditions before scrolling the chart forward.
Common mistakes
Looking for confirmations far from the defined zones.
Judging a candle before it has closed.
Interpreting every candle as a signal.
7
Level 7
Liquidity
Full content in preparation
Many orders, including stop losses, cluster above obvious highs and below obvious lows: equal highs and lows, and session, previous-day and weekly levels. A sweep is when price briefly moves beyond one of these levels and then comes back. For session levels, it is best to always use the same time windows in UTC and to state the exact date of each level.
Learning objectives
Mark equal highs and lows.
Mark session, daily and weekly highs and lows, using times in UTC.
Recognise a liquidity sweep.
Distinguish a sweep from a break of structure.
Demo account exercise
For one week, on a demo account, mark each day the high and low of the Asian session and of the previous day, with the date and times in UTC. Note whether and when they are exceeded and whether price comes back immediately afterwards.
Common mistakes
Using different time windows from one day to the next.
Treating every move beyond a level as a sweep.
Referring to a level with relative expressions ("last week") instead of the date.
8
Level 8
Zones, traps and news
Full content in preparation
A fair value gap is an imbalance across three consecutive candles in which the first and third do not overlap. An order block is, generally, the last opposite-coloured candle before a strong move. High-impact US news (for example employment and inflation data or central bank decisions) can cause rapid moves and a widening of the spread. Stops tend to build up near the most obvious levels, which is why these often become targets for sweeps.
Learning objectives
Recognise a fair value gap (FVG).
Recognise an order block and its limitations.
Consult an economic calendar and mark high-impact US news.
Understand where stops build up.
Demo account exercise
For one week, before the start of each day, mark the high-impact US news from the economic calendar with the time in UTC. On the demo account, observe the spread and price movement in the minutes around the release and note what you see.
Common mistakes
Treating every FVG or order block as valid.
Studying entries right around a news release without considering the spread.
Placing the stop exactly on the most obvious level without taking sweeps into account.
Fibonacci retracements and extensions
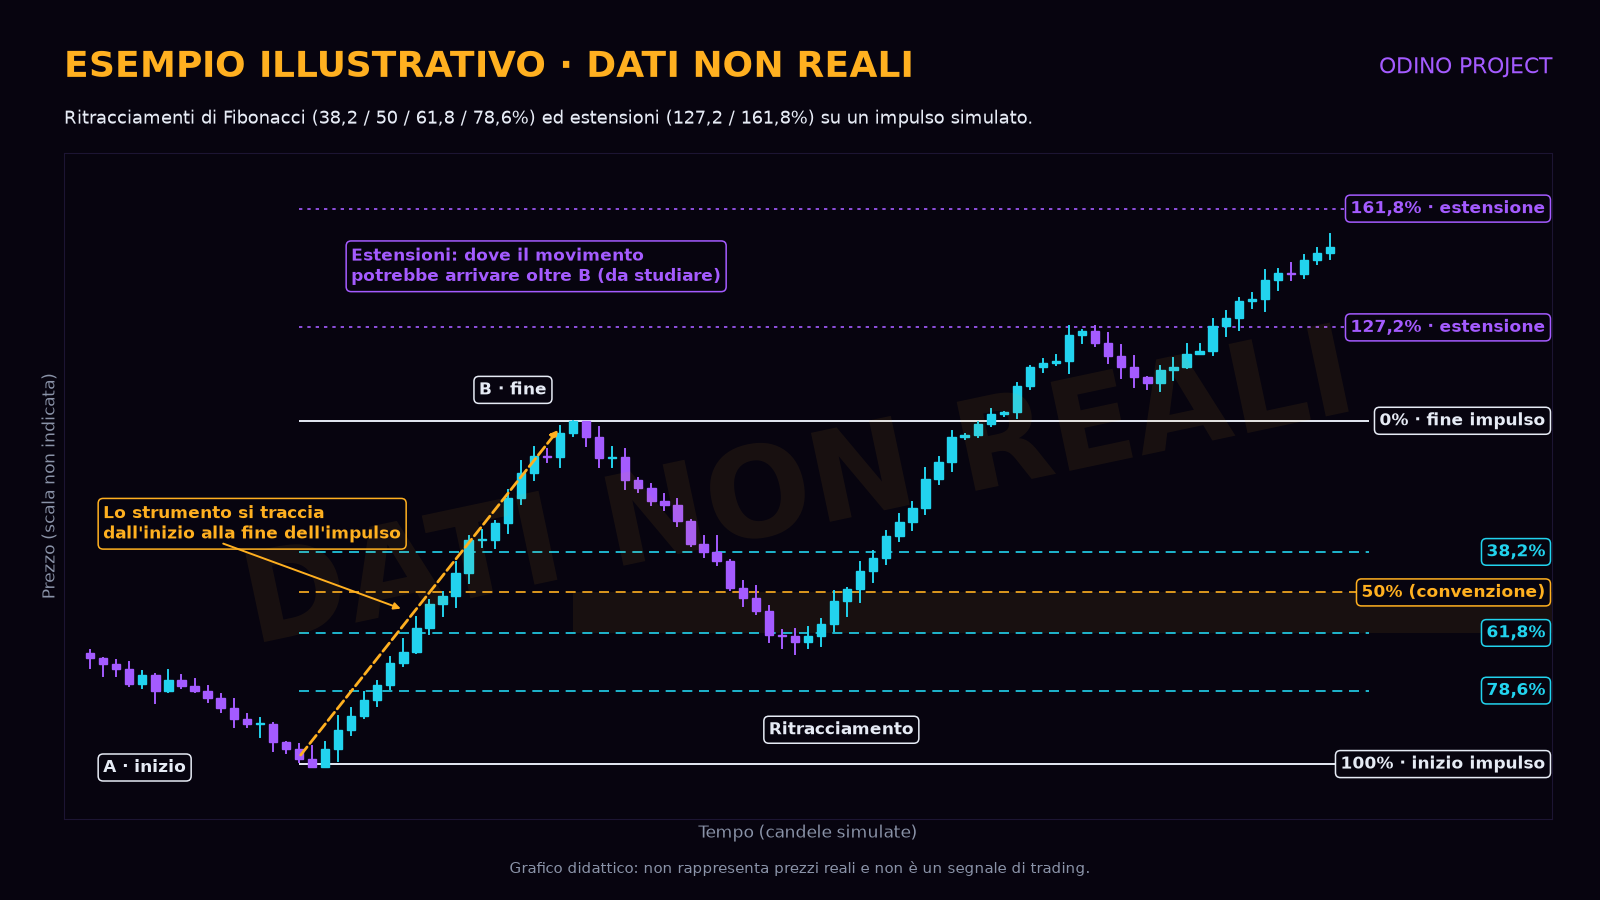
The Fibonacci tool, available on almost every charting platform, divides an impulse into percentage levels. It is drawn from the start to the end of the impulse: in a bullish move from the low to the high, in a bearish move from the high to the low. On the chart, 0% coincides with the end of the impulse and 100% with its start; the intermediate levels show how much of the impulse has been retraced.
The most commonly used retracement levels are 38.2%, 50%, 61.8% and 78.6%. The 38.2% and 61.8% levels derive from the ratios between numbers in the Fibonacci sequence; 78.6% is the square root of 0.618. 50% is not a Fibonacci number: it is added by convention because it marks the midpoint of the impulse, i.e. the equilibrium seen in Level 3. Read it carefully: the tool measures the retracement from the end of the impulse, so in a bullish impulse the 61.8% and 78.6% levels fall in the lower half (discount zone) and 38.2% in the upper half (premium zone).
The 127.2% and 161.8% extensions are projected beyond the end of the impulse, measured on its length, and are used to study where a move might reach if it continues beyond the end point. On some platforms they appear as -27.2% and -61.8%. They do not indicate where price will go: they are reference points to be verified.
On its own, a Fibonacci level says little. It becomes worth studying when there is confluence, i.e. when it coincides with other independent elements: a structural reference (a previous high or low, an order block, a fair value gap), a liquidity level (equal highs or lows, session or previous-day levels) or the premium/discount zone consistent with the direction of the structure. The more elements overlap in the same area, the more attention that area deserves in the analysis, but it remains a hypothesis to be verified, not a certainty.
Illustrative example · non-real data. Chart with simulated data, created for educational purposes.
It does not represent real prices and is not a signal.
Learning objectives
Draw the tool on the correct impulse, from start to end.
Recognise the 38.2%, 50%, 61.8% and 78.6% levels, knowing that 50% is a convention.
Use the 127.2% and 161.8% extensions as study references.
Look for confluence with structure and liquidity.
Demo account exercise
On historical data in a demo account, choose ten impulses that broke the structure on H1 or H4 and draw the tool on each one. Note at which level, if any, price reacted during the retracement and whether there was confluence in that area with a structural reference or a liquidity level. If the move continued beyond the end of the impulse, note what happened near the extensions. Write down your observations before scrolling the chart forward.
Common mistakes
Drawing the tool on minor swings or on an impulse that did not break the structure.
Drawing in the wrong direction and reading the levels the wrong way round.
Treating every level as a guaranteed reaction point.
Filling the chart with levels until you see confluence everywhere.
Moving the tool after seeing how things turned out.
Once we have the results of our tests on historical data, we will add the resulting observations here.
9
Level 9
Complete method and diary
Full content in preparation
The last level brings the previous ones together: context on the higher timeframes, structure, liquidity, zone, confirmation on M5 and risk management. The method is studied with a written plan, tested through backtesting on a demo account and improved with a diary in which every case is recorded and reviewed after the fact.
Learning objectives
Combine structure, liquidity, zones and confirmation into a coherent sequence.
Write a study plan with clear rules.
Backtest on a demo account with an adequate sample of cases.
Keep a diary and carry out after-the-fact reviews.
Demo account exercise
Create a diary (spreadsheet or notebook) with these columns: date and time in UTC, timeframe, context, zone, confirmation, stop loss, risk, outcome, observed mistake. Record at least 20 cases on a demo account or on historical data and review them at the end of the week.
Common mistakes
Changing the rules after a few losses.
Not recording negative cases.
Evaluating the method on too small a number of cases.
Trading diary (PDF)
A printable 7-page study tool (PDF, about 110 KB) for recording and reviewing after the fact the cases
analysed on a demo account or on historical data, as set out in Level 9. It is purely educational material and
does not constitute financial advice.
The Weekly lessons will be a weekly educational recap of the lessons that emerge
from analysis and after-the-fact reviews. They will be published on the
Weekly lessons page (Italian), and each lesson will indicate the study path level it
relates to, so that it can be reviewed in the right context.
First edition in preparation
⚠ Important notice
The content of this site is for educational and study purposes only. It does not constitute financial
advice, trading signals or a solicitation to invest.
Trading Forex, gold and CFDs involves a high risk of losing your capital
and may not be suitable for everyone. Past results are not indicative of future results.
Every trading decision is yours alone: if you decide to trade, only do so with capital you can afford to lose.