⚠ Notice: educational and study content. It does not constitute financial advice or trading signals. Trading Forex and gold involves a high risk of losing your capital.

Study community · Gold (XAUUSD)

Odino Project

A learning community dedicated to a method of reading the market applied to gold (XAUUSD): price action, market structure and liquidity. Here we study, ask questions and compare notes with fellow learners. No signals, no investment advice.

  • XAUUSD
  • Price action
  • Market structure
  • Liquidity
Odino Project logo: a stylised face made of purple and cyan neon circuits, flanked by two ravens

The method

The method we study does not rely on complex indicators: it reads the gold chart starting from three simple ideas. Learning to recognise them on your own chart is the core of the study path.

Price action

We observe price movement as it is: candles, rejections of levels, breaks and retracements. The aim is to understand who is taking control, buyers or sellers.

Market structure

We identify significant highs and lows to establish the trend (bullish, bearish or sideways) and recognise when the structure changes. Entries are studied in the direction of the structure.

Liquidity zones

Many orders (for example stop losses) build up above obvious highs and below obvious lows. These are zones where price often tends to react, and we learn to take them into account when evaluating entries and exits.
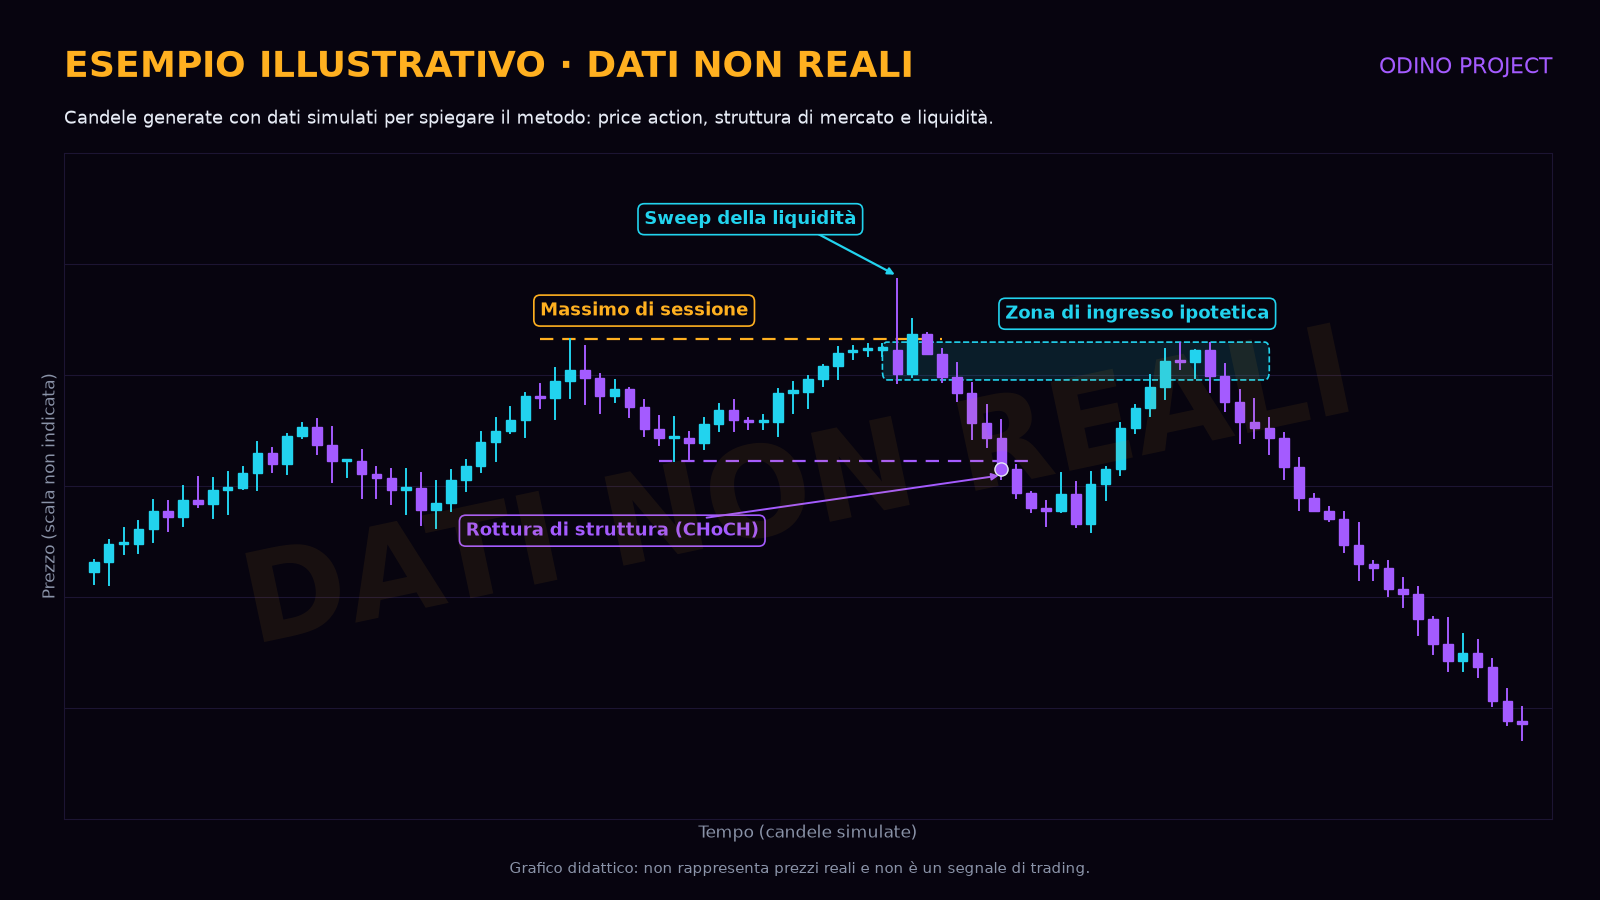
Illustrative example with non-real data: simulated candles with a session high, a liquidity sweep, a break of structure (CHoCH) and a hypothetical entry zone
Illustrative example · non-real data. Illustrative chart with simulated data, created for educational purposes. It does not represent real prices and is not a signal.

An example to study

This is the framework the lessons are based on: it is meant to help you understand the method, it is not a service nor an invitation to replicate it.

  • Instrument: XAUUSD only (gold against the US dollar).
  • Entries: studied on the M5 timeframe.
  • Exits: two take profits (TP1 and TP2), each at about 300 pips, i.e. about $30 of movement in the gold price (convention used here: 1 pip = $0.10).
  • Protection: every entry has a stop loss.

Some brokers define the gold pip differently: check the symbol specifications on your platform. No method eliminates risk: losses are part of trading.

Study sections

Four separate pages to study the method: a progressive study path, a weekly recap, annotated historical cases and the weekly zone map.

Study path

Nine levels in progressive order, from market basics to the complete method with a diary. For each level: objectives, explanation, a demo account exercise and common mistakes.

A printable Trading diary (PDF) (Italian) is also available.

Go to the study path

Weekly lessons

A weekly educational recap of lessons and recurring mistakes, with references to the study path levels. No signals.

First edition in preparation

See the format

Structure analysis

Only historical cases that have already played out, for educational purposes: reading swings, HH/HL/LH/LL, BOS and CHoCH, and what happened next.

First case in preparation

See the format

Weekly zone map

Every Sunday, the structure and liquidity zones to study, with the educational reason and the study path level. No direction, entry, stop or target.

First map in preparation

See the format

The team

The lessons come from the work of a few automated analysis systems that operate for the project only: they are not available to the public and do not send signals. Here they share only educational lessons, drawn from market analysis and after-the-fact reviews.

Coordination

Gathers the work of the analysis systems and organises it into coherent lessons.

Content and communication

Looks after the website and the writing of the study material.

Decorative illustration: a stylised raven with wings traced by purple and cyan circuits

Analysis

Two systems handle the market analysis; their observations, reviewed after the fact, become the lessons on this site.

Market structure and price action

Analyses highs and lows, trends, breaks of structure and price reactions.

Liquidity and volume

Analyses liquidity zones, session levels and volume patterns.

⚠ Important notice

The content of this site is for educational and study purposes only. It does not constitute financial advice, trading signals or a solicitation to invest. Trading Forex, gold and CFDs involves a high risk of losing your capital and may not be suitable for everyone. Past results are not indicative of future results. Every trading decision is yours alone: if you decide to trade, only do so with capital you can afford to lose.

Frequently asked questions

What is the Odino Project?

On this site, the Odino Project is a learning community: we study a method based on price action, market structure and liquidity applied to gold (XAUUSD) and compare notes with fellow learners. The material comes from the lessons of the project's analysis systems.

Do you give trading signals or advice?

No. We do not give signals, we do not say when to buy or sell and we do not offer financial advice. All content is intended only for studying the method.

Can I use your bots?

No. The Odino Project bots work only for the project owner and are not available to the public, either free or paid. Here we share only their lessons.

Do I need experience to take part?

No, we start from the basics: what a pip is, what a stop loss is, how to read a candlestick chart. To practise, we recommend using a demo account, so you can observe the method on the chart without risking real money.

Which instrument and timeframe are studied?

Only XAUUSD (gold against the dollar), with entries studied on the M5 timeframe and two take profits of about 300 pips each. Here 1 pip on XAUUSD is worth $0.10, so each TP corresponds to about $30 of price movement. Some brokers define the gold pip differently: check the symbol specifications.

Does the method guarantee profits?

No. No method can guarantee profits. The market changes and there are always periods of losses. Be wary of anyone promising guaranteed gains or fixed returns.

Where do the lessons come from?

From the team's market analysis and after-the-fact reviews. Each lesson is collected in a shared lessons file, with the problem, the cause, what to do and the bot that verified it. The entries in the Help section below come from these lessons.

Help: studying the method on your chart

Common problems when comparing the lessons with your own chart or a demo account. The exact names of menus and options may vary depending on the platform you use.

The levels on my chart do not match those in the lessons
  1. The lessons use XAUUSD spot prices.
  2. Gold futures (GC) can trade even tens of dollars above spot. There can also be small differences between different spot price providers.
  3. Use an XAUUSD spot chart and compare the distances between levels (for example how many dollars or pips separate the entry and the TP), not just the absolute prices.
  4. If your feed is still slightly different, compare a common reference price (for example the close of the last weekly candle) on your chart and in the lesson, and shift the levels by the same difference.
The session highs and lows (Asia, London, New York) do not match
  1. The broker's server time and the session windows vary from source to source: if the chart uses a different time zone, the session highs and lows will also differ.
  2. The lessons use these UTC windows: Asia from 21:00 to 06:00, London from 07:00 to 16:00, New York from 12:00 to 21:00, with H4 candles starting at 21:00 UTC.
  3. Check the time zone set on your chart (in your platform settings) and recalculate the highs and lows using the same UTC windows.
The time of a low or a high does not match my chart
  1. Times may come from different time zones: for example 13:30 in Bucharest (UTC+3) is 10:30 UTC.
  2. Always write and compare times in UTC; if you use another time zone, state it.
"Previous week" or "this week"? The same low has different names
  1. "Previous week" changes meaning depending on the day you read it: at the weekend it usually refers to the week that has just closed, but from the following Monday that same week becomes the "previous" one relative to a different week.
  2. This is why two analyses may give different names to the same weekly low.
  3. Always give the exact date of the level (for example "Thursday's low" followed by the date in dd/mm format) instead of a relative expression.
I cannot find gold on my chart or demo account (e.g. XAUUSD.m, GOLD)
  1. Many brokers add prefixes or suffixes to the symbol (e.g. XAUUSD.m, XAUUSDpro) or call it GOLD.
  2. Search for "XAU" or "GOLD" in the platform's symbol list (in MetaTrader this is the Market Watch window) and open the chart of the spot instrument.
  3. Avoid futures symbols (GC): their prices do not match those in the lessons.
The pip value at my broker is different
  1. In the lessons, 1 pip on XAUUSD is worth $0.10: TPs of about 300 pips therefore correspond to about $30 of price movement.
  2. Some brokers or platforms define the gold pip differently: check the symbol specifications.
  3. When in doubt, think in dollars of price movement, which do not depend on how your broker counts pips.
The spread on gold widens during news or at session changes
  1. The spread on XAUUSD can widen considerably, for example at session changes, overnight or during major news (US data, central banks).
  2. When you study an entry, take the current spread into account: it can change the actual entry price and the distance to the stop loss and TP.
  3. On the demo account, watch how the spread varies at different times of day, to understand when an entry on the chart would have been unrealistic.
Market closed or daily break
  1. The market is closed at the weekend and XAUUSD usually has a daily break, whose times depend on the broker.
  2. Check your broker's trading sessions in the symbol specifications.
  3. During breaks the chart does not update: this is normal, not a platform error.